27
How many Masons does it take?


| Discussion points: | ||||
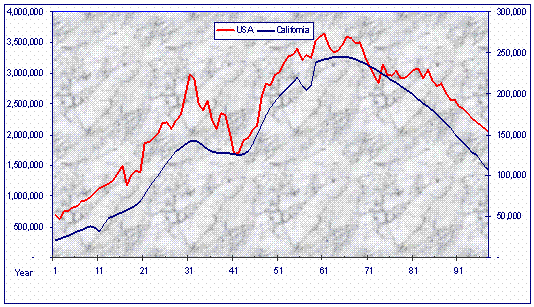
| Topic: Growth of GL of Ca. - Graphic | ||||
| Timeline: 1900 - 1999 | ||||
| •From 1850 until 1900, | ||||
| •just about no records were kept on how many Masons there were in the US, or in California. | ||||
| •This chart, however, shows the statistics from 1900 through 1997. | ||||
| •The figures are from Brother Paul Bessel’s wonderfully informative site, at bessel.org | ||||
| •The site is just full of statistical information. | ||||
| •Blue line and right axis represent California Masons, | ||||
| •Red line and left axis represent Masons in the USA. | ||||
| •These are, in some cases, estimates. | ||||
| •Note the similarity in the curve. | ||||
| •Note the dip in the 1940’s and | ||||
| •Note the downward trend we see starting in the 1970’s. | ||||
| •Note the climbs in the 20’s, and 50’s. | ||||
| •What social issues were at play during the “high times”, and the “Low times”? | ||||